
Orange County Area Info from City-Data.com
County population in July 2009: 3,026,786 (100% urban, 0% rural)
County owner-occupied houses and condos: 574,193
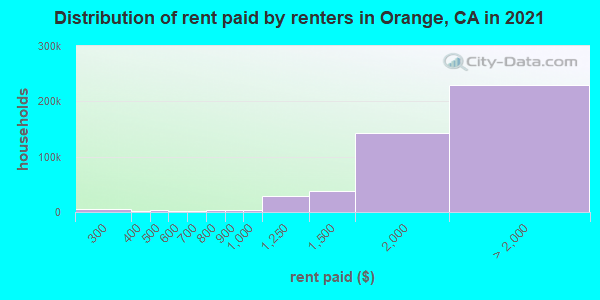
Renter-occupied apartments: 361,094
| % of renters here: | 39% |
| State: | 39% |
Land area: 789 sq. mi.
Water area: 158.6 sq. mi.
| Population density: 3834 people per square mile |
|
(very high). |
Jan. 2011 cost of living index in Orange County: 124.6 (high, U.S. average is 100)
Industries providing employment: Manufacturing (17.0%), Educational,health and social services (16.1%), Professional,scientific,management,administrative,and waste management services (12.6%), Retail trade (11.2%).
Type of workers Orange County Area Info:
- Private wage or salary: 80%
- Government: 11%
- Self-employed, not incorporated: 8%
- Unpaid family work: 0%
| Median resident age: | |
| California median age: |
| Males: 1,416,045 | |
| Females: 1,430,244 |
Average household size Orange County Area Info:
| Orange County: | 3.0 people |
| California: | 3 people |
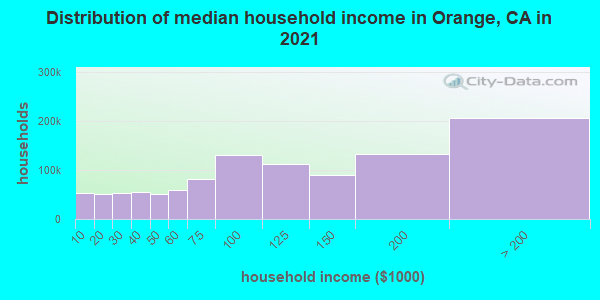
Estimated median household income in 2009 Orange County Area Info: $71,865 ($58,820 in 1999)
| This county: | $71865 |
| California: | $58931 |
Median contract rent in 2009 for apartments Orange County Area Info: $1,367 (lower quartile is $1,074, upper quartile is $1,769)
| This county: | $1367 |
| State: | $1058 |
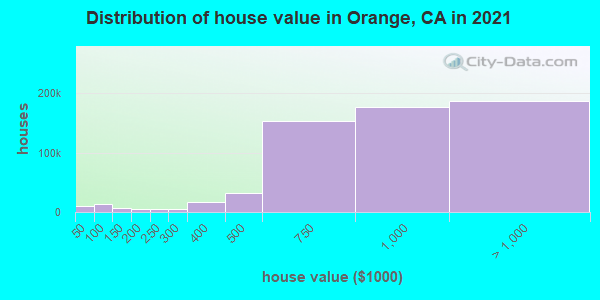
Estimated median house or condo value in 2009 Orange County Area Info: $530,400 (it was $253,000 in 2000)
| Orange County: | $530,400 |
| California: | $384,200 |
Lower value quartile – upper value quartile Orange County Area Info: $357,000 – $738,800
Mean price in 2009:
Detached houses: $716,633
Here: $716,633 State: $521,364 Townhouses or other attached units: $426,630
Here: $426,630 State: $436,871 In 2-unit structures: $802,070
Here: $802,070 State: $634,434 In 3-to-4-unit structures: $327,157
Here: $327,157 State: $443,730 In 5-or-more-unit structures: $308,489
Here: $308,489 State: $418,318 Mobile homes: $95,807
Here: $95,807 State: $59,450 Occupied boats, RVs, vans, etc.: $31,201
Here: $31,201 State: $63,652
Median monthly housing costs for homes and condos with a mortgage: $2,657
Median monthly housing costs for units without a mortgage: $469
Institutionalized population: 16,464
Crime in 2005 (reported by the sheriff’s office or county police, not the county total):
- Murders: 1
- Rapes: 10
- Robberies: 38
- Assaults: 193
- Burglaries: 371
- Thefts: 919
- Auto thefts: 224
Crime in 2004 (reported by the sheriff’s office or county police, not the county total):
- Murders: 2
- Rapes: 10
- Robberies: 29
- Assaults: 205
- Burglaries: 323
- Thefts: 932
- Auto thefts: 241
Orange County Area Info
Health of residents in Orange County based on CDC Behavioral Risk Factor Surveillance System Survey Questionnaires from 2003 to 2009:
General health status score of residents in this county from 1 (poor) to 5 (excellent) is 3.6. This is about average.
81.1% of residents exercised in the past month. This is more than average.
39.3% of residents smoked 100+ cigarettes in their lives. This is less than average.
99.9% of adult residents drank alcohol in the past 30 days. This is more than average.
76.4% of residents visited a dentist within the past year. This is more than average.
Average weight of males is 187 pounds. This is about average.
Average weight of females is 151 pounds. This is about average.
Single-family new house construction building permits:
- 2000: 6814 buildings, average cost: $225,300
- 2001: 6010 buildings, average cost: $230,000
- 2002: 6794 buildings, average cost: $226,500
- 2003: 6108 buildings, average cost: $223,700
- 2004: 4828 buildings, average cost: $262,700
- 2005: 4103 buildings, average cost: $288,100
- 2006: 3744 buildings, average cost: $285,500
- 2007: 2279 buildings, average cost: $319,700
- 2008: 1330 buildings, average cost: $350,300
- 2009: 1341 buildings, average cost: $314,200
| Orange County | California average |
| 2004 Presidential Election results in Orange County California: |
Bush/Cheney (Republican): 59.7%
Kerry/Edwards (Democratic): 39.0%
| 2008 Presidential Election results in Orange County California: |
McCain (Republican): 50.5%
Obama (Democratic): 48.0%
Detailed 2008 Election Results
Median real estate property taxes paid for housing units with mortgages in 2009: $3,869 (0.7%)
Median real estate property taxes paid for housing units with no mortgage in 2009: $1,507 (0.3%)
 |
 |
Orange County Area Info
Percentage of residents living in poverty in 2009: 10.7%
(5.8% for White Non-Hispanic residents, 13.0% for Black residents, 17.3% for Hispanic or Latino residents, 18.6% for other race residents, 7.0% for two or more races residents)
Percentage of residents living in poverty in 2009: 10.7%
| Orange County: | 10.7% |
| California: | 14.2% |
(5.8% for White Non-Hispanic residents, 13.0% for Black residents, 17.3% for Hispanic or Latino residents, 18.6% for other race residents, 7.0% for two or more races residents)
Median age of residents in 2009: 35 years old
(Males: 34 years old, Females: 36 years old)
(Median age for: White residents: 44 years old, Black residents: 33 years old, American Indian residents: 39 years old, Asian residents: 37 years old, Hispanic or Latino residents: 26 years old, Other race residents: 27 years old)
Fair market rent in 2006 for a 1-bedroom apartment in Orange County is $1161 a month.
Fair market rent for a 2-bedroom apartment is $1392 a month.
Fair market rent for a 3-bedroom apartment is $1992 a month.
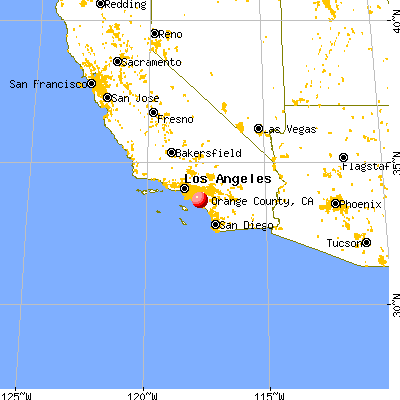
Cities in this county include: Santa Ana, Anaheim, Huntington Beach, Garden Grove, Irvine, Orange, Fullerton, Costa Mesa, Mission Viejo, Westminster.
Orange County has a predicted average indoor radon screening level less than 2 pCi/L (pico curies per liter) – Low Potential
| Zip code | City | Number of tests | Number of tests >= 4 pCi/L |
|---|---|---|---|
| 90620 | Buena Park | 20 | 0 |
| 90621 | Buena Park | 7 | 1 |
| 90623 | La Palma | 19 | 0 |
| 90630 | Cypress | 50 | 1 |
| 90631 | La Habra | 35 | 5 |
| 90680 | Stanton | 9 | 0 |
| 90720 | Los Alamitos | 33 | 0 |
| 90740 | Seal Beach | 24 | 1 |
| 90743 | Surfside | 1 | 0 |
| 92602 | Irvine | 5 | 1 |
| 92603 | Irvine | 15 | 0 |
| 92604 | Irvine | 41 | 4 |
| 92606 | Irvine | 13 | 0 |
| 92607 | Laguna Niguel | 1 | 0 |
| 92610 | Foothill Ranch | 21 | 1 |
| 92612 | Irvine | 13 | 0 |
| 92614 | Irvine | 37 | 2 |
| 92615 | Huntington Beach | 4 | 0 |
| 92618 | Irvine | 24 | 0 |
| 92620 | Irvine | 43 | 3 |
| 92624 | Capistrano Beach | 3 | 1 |
| 92625 | Corona Del Mar | 42 | 5 |
| 92626 | Costa Mesa | 70 | 5 |
| 92627 | Costa Mesa | 44 | 2 |
| 92628 | Costa Mesa | 1 | 0 |
| 92629 | Dana Point | 34 | 0 |
| 92630 | Lake Forest | 88 | 0 |
| 92637 | Laguna Woods | 7 | 0 |
| 92646 | Huntington Beach | 69 | 0 |
| 92647 | Huntington Beach | 97 | 1 |
| 92648 | Huntington Beach | 64 | 2 |
| 92649 | Huntington Beach | 47 | 2 |
| 92651 | Laguna Beach | 46 | 2 |
| 92653 | Laguna Hills | 108 | 5 |
| 92654 | Laguna Hills | 6 | 0 |
| 92655 | Midway City | 10 | 0 |
| 92656 | Aliso Viejo | 73 | 2 |
| 92657 | Newport Coast | 19 | 0 |
| 92660 | Newport Beach | 53 | 0 |
| 92663 | Newport Beach | 60 | 8 |
| 92672 | San Clemente | 47 | 4 |
| 92673 | San Clemente | 63 | 1 |
| 92674 | San Clemente | 1 | 1 |
| 92675 | San Juan Capistrano | 39 | 4 |
| 92676 | Silverado | 3 | 0 |
| 92677 | Laguna Niguel | 134 | 9 |
| 92679 | Trabuco Canyon | 100 | 0 |
| 92683 | Westminster | 47 | 0 |
| 92685 | Westminster | 55 | 0 |
| 92688 | Rancho Santa Margarita | 79 | 0 |
| 92690 | Mission Viejo | 4 | 0 |
| 92691 | Mission Viejo | 77 | 4 |
| 92692 | Mission Viejo | 116 | 3 |
| 92693 | San Juan Capistrano | 3 | 0 |
| 92697 | Irvine | 2 | 0 |
| 92698 | Irvine | 1 | 0 |
| 92701 | Santa Ana | 4 | 0 |
| 92703 | Santa Ana | 4 | 0 |
| 92704 | Santa Ana | 14 | 2 |
| 92705 | Santa Ana | 64 | 5 |
| 92706 | Santa Ana | 13 | 0 |
| 92707 | Santa Ana | 14 | 0 |
| 92708 | Fountain Valley | 56 | 0 |
| 92728 | Fountain Valley | 1 | 0 |
| 92780 | Tustin | 39 | 1 |
| 92782 | Tustin | 23 | 4 |
| 92801 | Anaheim | 28 | 2 |
| 92802 | Anaheim | 17 | 0 |
| 92804 | Anaheim | 30 | 0 |
| 92805 | Anaheim | 27 | 1 |
| 92806 | Anaheim | 29 | 1 |
| 92807 | Anaheim | 56 | 5 |
| 92808 | Anaheim | 32 | 0 |
| 92814 | Anaheim | 1 | 0 |
| 92817 | Anaheim | 2 | 0 |
| 92821 | Brea | 58 | 1 |
| 92823 | Brea | 5 | 2 |
| 92831 | Fullerton | 41 | 3 |
| 92832 | Fullerton | 12 | 0 |
| 92833 | Fullerton | 24 | 2 |
| 92834 | Fullerton | 8 | 0 |
| 92835 | Fullerton | 23 | 2 |
| 92840 | Garden Grove | 58 | 0 |
| 92841 | Garden Grove | 9 | 0 |
| 92843 | Garden Grove | 5 | 0 |
| 92844 | Garden Grove | 13 | 0 |
| 92845 | Garden Grove | 23 | 0 |
| 92861 | Villa Park | 12 | 4 |
| 92865 | Orange | 145 | 4 |
| 92866 | Orange | 18 | 0 |
| 92867 | Orange | 43 | 3 |
| 92868 | Orange | 4 | 0 |
| 92869 | Orange | 37 | 1 |
| 92870 | Placentia | 60 | 8 |
| 92885 | Yorba Linda | 1 | 0 |
| 92886 | Yorba Linda | 76 | 7 |
| 92887 | Yorba Linda | 46 | 4 |
2005 air pollution in Orange County:
Carbon Monoxide: 3 ppm (standard limit: 9 ppm). Near U.S. average.
Nitrogen Dioxide: 0.025 ppm (standard limit: 0.053 ppm). Above U.S. average.
Ozone (1-hour): 0.107 ppm (standard limit: 0.12 ppm). Near U.S. average.
Ozone (8-hour): 0.079 ppm (standard limit: 0.08 ppm). Near U.S. average.
Particulate Matter (PM10) Annual: 28 µg/m3. Near U.S. average.
Particulate Matter (PM10) 24-hour: 54 µg/m3(standard limit: 150 µg/m3). Near U.S. average.
Particulate Matter (PM2.5) Annual: 14.7 µg/m3(standard limit: 15.0 µg/m3). Near U.S. average.
Particulate Matter (PM2.5) 24-hour: 42 µg/m3(standard limit: 35 µg/m3). Near U.S. average.
Sulfur Oxides Annual: 0.002 ppm (standard limit: 0.03 ppm). Near U.S. average.
Sulfur Oxides 24-hour: 0.007 ppm (standard limit: 0.14 ppm). Near U.S. average.
Notable locations in this county outside city limits:
Notable locations in Orange County: Blue Jay Campground (A), Starr Ranch (B), Bolero Lookout (C), Bolsa Chica Gun Club (D), Silverado Station (E), San Juan Station (F), Joplin Boys Ranch (G), Marine Memorial Golf Course (H), County Industrial Farm (I), McConville Nudist Camp (J), Four S Ranch(K), Old Camp (L), Mission Vieja (M), Youth Conservation Camp (N), Hidden Ranch (O), Trabuco Guard Station (P), Trabuco Campground (Q), Falcon Campground (R), Silverado Branch Orange County Public Library (S), James H Musick Branch Jail (T). Display/hide their locations on the map
Church in Orange County: Ramakrishna Monastery (A). Display/hide its location on the map
Reservoirs: Siphon Reservoir (A), Rattlesnake Reservoir (B), Modjeska Reservoir (C), Irvine Lake (D), Syphon Reservoir (E), Lambert Reservoir (F), Santiago Reservoir (G). Display/hide their locations on the map
Creeks: Black Star Creek (A), Coal Creek (B), Silverado Creek (C). Display/hide their locations on the map
Parks in Orange County include: Rancho Mission Viejo Ecological Reserve (1), Irvine Park (2), Irvine Lake Park (3), Casper Regional Park (4), Sunset County Beach (5), Swanson Park (6), Tucker Wildlife Sanctuary (7), Whiting Ranch Wilderness Park (8), Blue Gum Park (9). Display/hide their locations on the map
Post offices: Modjeska Canyon Post Office (A), Sliverado Post Office (B). Display/hide their locations on the map
Neighboring counties: Los Angeles County  , Riverside County
  , San Bernardino County
  , San Diego County
  .
.
Unemployment in Apr. 2010:
| Here: | 9.1% |
| California: | 12.3% |
Current college students: 230,749
People 25 years of age or older with a high school degree or higher: 79.5%
People 25 years of age or older with a bachelor’s degree or higher: 30.8%
Number of foreign born residents: 849,899 (38% naturalized citizens)
| Orange County: | 29.9% |
| Whole state: | 26.2% |
Mean travel time to work (commute): 27.2 minutes
Percentage of county residents living and working in this county: 83.0%
Housing units in structures:
- One, detached: 490,141
- One, attached: 124,610
- Two: 18,191
- 3 or 4: 70,468
- 5 to 9: 59,502
- 10 to 19: 46,519
- 20 or more: 127,594
- Mobile homes: 31,265
- Boats, RVs, vans, etc.: 1,194
Housing units in Orange County with a mortgage: 407,386 (58,493 second mortgage, 42,002 home equity loan, 1,824 both second mortgage and home equity loan)
Houses without a mortgage: 83,108
| Here: | 83.1% with mortgage |
| State: | 79.0% with mortgage |
Religion statistics:
Percentage of population affiliated with a religious congregations: 44.78%
| Here | 44.8% | |
| USA | 50.2% |
Total adherents: 1,274,591
Total congregations: 1,085
Adherents
Breakdown of population affiliated with a religious congregations
| Name | Catholic Church | LDS (Mormon) Church | Charismatic Churches Independent | Muslim Estimate | Southern Baptist Convention |
|---|---|---|---|---|---|
| Adherents | 779,647 (61.2%) | 48,776 (3.8%) | 43,100 (3.4%) | 39,583 (3.1%) | 32,652 (2.6%) |
| Congregations | 61 (5.6%) | 115 (10.6%) | 13 (1.2%) | 16 (1.5%) | 77 (7.1%) |
| Name | Presbyterian Church (USA) | Non-Charismatic Churches Independent | Evangelical Lutheran Church in America | Assemblies of God | Other |
|---|---|---|---|---|---|
| Adherents | 25,740 (2.0%) | 22,490 (1.8%) | 22,140 (1.7%) | 21,198 (1.7%) | 239,265 (18.8%) |
| Congregations | 38 (3.5%) | 12 (1.1%) | 37 (3.4%) | 71 (6.5%) | 645 (59.4%) |
Source: Jones, Dale E., et al. 2002. Congregations and Membership in the United States 2000. Nashville, TN: Glenmary Research Center.
Food Environment Statistics:
| This county: | 1.78 / 10,000 pop. |
| California: | 2.14 / 10,000 pop. |
| Orange County: | 0.06 / 10,000 pop. |
| State: | 0.04 / 10,000 pop. |
| Orange County: | 0.49 / 10,000 pop. |
| California: | 0.62 / 10,000 pop. |
Number of convenience stores (with gas): 434
| This county: | 1.46 / 10,000 pop. |
| California: | 1.49 / 10,000 pop. |
Number of full-service restaurants: 2,438
| Orange County: | 8.19 / 10,000 pop. |
| California: | 7.42 / 10,000 pop. |
Adult diabetes rate:
| Here: | 6.3% |
| California: | 7.3% |
Adult obesity rate:
| Here: | 18.5% |
| California: | 21.3% |
Low-income preschool obesity rate:
| Orange County: | 16.4% |
| State: | 17.9% |
Agriculture in Orange County:
Average size of farms: 195 acres
Average value of agricultural products sold per farm: $800,592
Average value of crops sold per acre for harvested cropland: $26185.87
The value of nursery, greenhouse, floriculture, and sod as a percentage of the total market value of agricultural products sold: 68.04%
The value of livestock, poultry, and their products as a percentage of the total market value of agricultural products sold: 0.44%
Average total farm production expenses per farm: $601,517
Harvested cropland as a percentage of land in farms: 15.57%
Irrigated harvested cropland as a percentage of land in farms: 97.47%
Average market value of all machinery and equipment per farm: $95,053
The percentage of farms operated by a family or individual: 69.54%
Average age of principal farm operators: 58 years
Average number of cattle and calves per 100 acres of all land in farms: 1.17
Vegetables: 2,112 harvested acres
Land in orchards: 2,633 acres
Tornado activity:
Orange County historical area-adjusted tornado activity is significantly above California state average. It is 1.0 times below overall U.S. average.
Tornadoes in this county have caused 7 injuries recorded between 1950 and 2004.
On 3/16/1977, a category 1 (max. wind speeds 73-112 mph) tornado injured 4 people and caused between $500,000 and $5,000,000 in damages.
Earthquake activity:
Orange County-area historical earthquake activity is above California state average. It is 2458% greater than the overall U.S. average.
On 6/28/1992 at 11:57:34, a magnitude 7.6 (6.2 MB, 7.6 MS, 7.3 MW, Depth: 0.7 mi, Class: Major, Intensity: VIII – XII) earthquake occurred 82.5 miles away from the county center, causing 3 deaths (1 shaking deaths, 2 other deaths) and 400 injuries, causing $100,000,000 total damage and $40,000,000 insured losses
On 10/16/1999 at 09:46:44, a magnitude 7.4 (6.3 MB, 7.4 MS, 7.2 MW, 7.3 ML) earthquake occurred 98.0 miles away from the county center
On 4/21/1918 at 22:32:30, a magnitude 6.8 (6.8 UK, Class: Strong, Intensity: VII – IX) earthquake occurred 24.9 miles away from the county center
On 6/28/1992 at 15:05:30, a magnitude 6.9 (6.3 MB, 6.7 MS, 6.5 MW, 6.9 ME, Depth: 3.1 mi) earthquake occurred 71.2 miles away from Orange County center
On 1/17/1994 at 12:30:55, a magnitude 6.8 (6.4 MB, 6.8 MS, 6.7 MW, Depth: 11.4 mi) earthquake occurred 50.4 miles away from the county center, causing 60 deaths (60 shaking deaths) and 7000 injuries
On 2/9/1971 at 14:00:41, a magnitude 6.5 (6.5 UK) earthquake occurred 55.3 miles away from the county center, causing 65 deaths (65 shaking deaths), causing $535,000,000 total damage
Magnitude types: body-wave magnitude (MB), energy magnitude (ME), local magnitude (ML), surface-wave magnitude (MS), moment magnitude (MW)
Most common industries in 2009 (%)
- Construction (10%)
- Professional, scientific, and technical services (9%)
- Accommodation and food services (7%)
- Administrative and support and waste management services (7%)
- Finance and insurance (5%)
- Educational services (5%)
- Health care (4%)
Most common occupations in 2009 (%)Males Females
| Orange County | California |
- Other management occupations except farmers and farm managers (7%)
- Building and grounds cleaning and maintenance occupations (6%)
- Other sales and related workers including supervisors (5%)
- Computer specialists (4%)
- Sales representatives, services, wholesale and manufacturing (4%)
- Other production occupations including supervisors (3%)
- Top executives (3%)
Most common places of birth for the foreign-born residents (%):
- Mexico (46%)
- Vietnam (13%)
- Korea (5%)
- Philippines (4%)
- Iran (2%)
- Taiwan (2%)
- Canada (2%)
Most common first ancestries reported in Orange County (%):
- German (9%)
- English (7%)
- Irish (6%)
- Italian (4%)
- United States or American (4%)
- French (except Basque) (2%)
- Polish (1%)
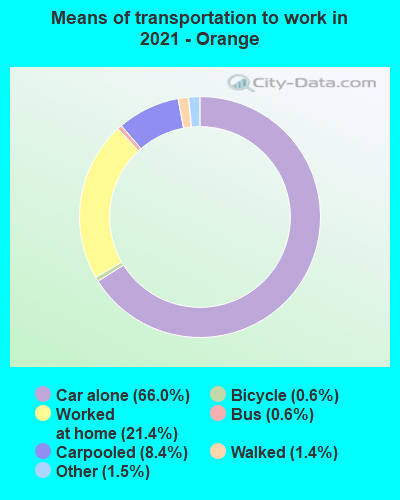 |
Means of transportation to work:
|
People in group quarters in Orange County, California:
- 9,628 people in college dormitories (includes college quarters off campus)
- 9,358 people in other noninstitutional group quarters
- 8,086 people in nursing homes
- 6,002 people in local jails and other confinement facilities (including police lockups)
- 1,825 people in homes for the mentally retarded
- 1,626 people in homes or halfway houses for drug/alcohol abuse
- 1,279 people in other group homes
- 1,110 people in other nonhousehold living situations
- 846 people in schools, hospitals, or wards for the mentally retarded
- 552 people in wards in general hospitals for patients who have no usual home elsewhere
- 507 people in religious group quarters
- 437 people in homes for the mentally ill
- 333 people in hospitals/wards and hospices for chronically ill
- 317 people in other hospitals or wards for chronically ill
- 150 people in training schools for juvenile delinquents
- 129 people in halfway houses
- 103 people in homes for abused, dependent, and neglected children
- 101 people in orthopedic wards and institutions for the physically handicapped
- 93 people in homes for the physically handicapped
- 82 people in mental (psychiatric) hospitals or wards
- 39 people in unknown juvenile institutions
- 34 people in military barracks, etc.
- 22 people in residential treatment centers for emotionally disturbed children
- 16 people in hospices or homes for chronically ill
- 10 people in other types of correctional institutions
- 9 people in hospitals or wards for drug/alcohol abuse
- 3 people in agriculture workers’ dormitories on farms
Average gross adjusted income of non-migrant taxpayers in this county in 2005 was $74,786.
5.21% of this county’s 2006 resident taxpayers lived in other counties in 2005 ($55,712 average adjusted gross income)
| Here: | 5.21% |
| California average: | 5.75% |
0.12% of residents moved from foreign countries ($728 average AGI)
Orange County: 0.12% California average: 0.21% 3.52% relocated from other counties in California ($36,608 average AGI)
1.57% relocated from other states ($18,376 average AGI)
Orange County: 1.57% California average: 1.75%
Top counties from which taxpayers relocated into this county between 2005 and 2006:
| from Los Angeles County, CA | |
| from Riverside County, CA | |
| from San Diego County, CA | |
| from San Bernardino County, CA | |
| from Maricopa County, AZ | |
| from Clark County, NV | |
| from Santa Clara County, CA |
6.37% of this county’s 2005 resident taxpayers moved to other counties in 2006 ($56,819 average adjusted gross income)
| Here: | 6.37% |
| California average: | 6.27% |
0.06% of residents moved to foreign countries ($471 average AGI)
Orange County: 0.06% California average: 0.11% 3.94% relocated to other counties in California ($31,944 average AGI)
2.36% relocated to other states ($24,404 average AGI)
Orange County: 2.36% California average: 2.40%
Top counties to which taxpayers relocated from this county between 2005 and 2006:
| to Los Angeles County, CA | |
| to Riverside County, CA | |
| to San Bernardino County, CA | |
| to San Diego County, CA | |
| to Maricopa County, AZ | |
| to Clark County, NV | |
| to King County, WA |
Births per 1000 population from 1990 to 1999: 19.0
Births per 1000 population from 2000 to 2006: 15.4
Deaths per 1000 population from 1990 to 1999: 6.0
Deaths per 1000 population from 2000 to 2006: 5.8
Infant deaths per 1000 live births from 1990 to 1999: 5.5
Infant deaths per 1000 live births from 2000 to 2006: 4.7
Persons enrolled in hospital insurance and/or supplemental medical insurance (Medicare) in July 1, 2003: 309,081 (281,334 aged, 27,747 disabled)
Population without health insurance coverage in 2000: 18%
Children under 18 without health insurance coverage in 2000: 15%
Homicides per 1,000,000 population from 2000 to 2006: 27.8. This is less than state average.
Mechanisms of homicide:
Deaths per 1,000,000 population:
- Firearm – 17.0
- Cut/Pierce – 4.4
- Suffocation – 1.1
- Other – 5.2
Suicides per 1,000,000 population from 2000 to 2006: 79.3. This is less than state average.
Mechanisms of suicide:
Deaths per 1,000,000 population:
- Firearm – 32.7
- Suffocation – 19.5
- Poisoning – 17.6
- Fall – 3.2
- Cut/Pierce – 1.7
- Drowning – 1.2
- Other – 3.4
Household type by relationship:
Households: 2,803,945
- In family households: 2,454,000 (527,155 male householders, 146,757 female householders)
539,143 spouses, 887,802 children (831,725 natural, 18,439 adopted, 37,638 stepchildren), 50,096 grandchildren, 54,126 brothers or sisters, 36,055 parents, 105,921 other relatives, 106,945 non-relatives
- In nonfamily households: 349,945 (120,573 male householders (82,212 living alone)), 141,669 female householders (114,798 living alone)), 87,703 nonrelatives
- In group quarters: 42,344 (16,162 institutionalized population)
Size of family households: 226,171 2-persons, 142,362 3-persons, 143,768 4-persons, 76,746 5-persons, 39,181 6-persons, 45,684 7-or-more-persons.
Size of nonfamily households: 197,010 1-person, 51,537 2-persons, 8,864 3-persons, 3,247 4-persons, 902 5-persons, 377 6-persons, 305 7-or-more-persons.
58.6% of residents of Orange County speak English at home.
25.3% of residents speak Spanish at home (42% speak English very well, 23% speak English well, 22% speak English not well, 13% don’t speak English at all).
4.1% of residents speak other Indo-European language at home (72% speak English very well, 19% speak English well, 7% speak English not well, 2% don’t speak English at all).
11.3% of residents speak Asian or Pacific Island language at home (43% speak English very well, 31% speak English well, 22% speak English not well, 4% don’t speak English at all).
0.8% of residents speak other language at home (70% speak English very well, 21% speak English well, 7% speak English not well, 3% don’t speak English at all).
In fiscal year 2004:
Federal Government expenditure: $13,834,698,000 ($4631 per capita)
Department of Defense expenditure: $3,072,368,000
Federal direct payments to individuals for retirement and disability: $4,614,550,000
Federal other direct payments to individuals: $2,894,759,000
Federal direct payments not to individuals: $6,419,000
Federal grants: $2,284,497,000
Federal procurement contracts: $3,160,372,000 ($2,629,188,000 Department of Defense)
Federal salaries and wages: $874,100,000 ($154,444,000 Department of Defense)
Federal Government direct loans: $113,313,000
Federal guaranteed/insured loans: $667,598,000
Federal Government insurance: $5,020,047,000
Population change from April 1, 2000 to July 1, 2005:
Births: 234,589
| Here: | 79 per 1000 residents |
| State: | 77 per 1000 residents |
Deaths: 88,691
| Here: | 30 per 1000 residents |
| State: | 34 per 1000 residents |
Net international migration: +140,891
| Here: | +47 per 1000 residents |
| State: | +39 per 1000 residents |
Net internal migration: -141,363
| Here: | |
| State: |
Total withdrawal of fresh water for public supply: 496.06 millions of gallons per day (53% from ground, 47% from surface)
Median number of rooms in houses and condos:
| Here: | 6.0 |
| State: | 5.8 |
Median number of rooms in apartments:
| Here: | 3.5 |
| State: | 3.5 |
50% of Orange County residents lived in the same house 5 years ago.
Out of people who lived in different houses, 71% lived in this county.
Out of people who lived in different counties, 70% lived in California.
| Orange County: | 50.4% |
| State average: | 52.5% |
Place of birth for U.S.-born residents:
- This state: 1322976
- Northeast: 159528
- Midwest: 251681
- South: 128936
- West: 108205
Median price asked for vacant for-sale houses in 2000: $270,400
Housing units lacking complete plumbing facilities: 1%
Housing units lacking complete kitchen facilities: 1%
Most commonly used house heating fuel in Orange CountyHouses and condos Apartments
- Utility gas (84.9%)
- Electricity (13.2%)
- Bottled, tank, or LP gas (0.9%)
- No fuel used (0.7%)
Private vs. public school enrollment:
Students in private schools in grades 1 to 8 (elementary and middle school): 37,810
| Here: | 10.6% |
| California: | 9.9% |
Students in private schools in grades 9 to 12 (high school): 10,681
| Here: | 6.5% |
| California: | 7.8% |
Students in private undergraduate colleges: 24,790
| Here: | 13.1% |
| California: | 15.4% |
Orange County government finances in 2006:
- Bond Funds – Cash and Securities: $247,306,000
- Charges – All Other: $326,386,000
Solid Waste Management: $113,739,000
Air Transportation: $101,936,000
Parks and Recreation: $41,500,000
Regular Highways: $13,441,000
Natural Resources – Other: $13,257,000
Elementary and Secondary Education – Other: $10,961,000
Housing and Community Development: $451,000
Parking Facilities: $317,000
Elementary and Secondary Education School Lunch: $125,000
- Construction – Natural Resources – Other: $20,445,000
General – Other: $6,659,000
Elementary and Secondary Education: $5,745,000
Housing and Community Development: $1,462,000
- Current Operations – Public Welfare – Other: $422,295,000
Health – Other: $325,216,000
General – Other: $317,914,000
Judicial and Legal Services: $294,115,000
Police Protection: $276,955,000
Elementary and Secondary Education: $188,373,000
Correctional Institutions: $178,413,000
Public Welfare, Vendor Payments for Medical Care: $120,250,000
Financial Administration: $95,760,000
Corrections – Other: $79,778,000
Solid Waste Management: $78,948,000
Air Transportation: $57,702,000
Natural Resources – Other: $46,423,000
Regular Highways: $44,464,000
Central Staff Services: $40,810,000
Libraries: $30,070,000
General Public Buildings: $18,905,000
Sea and Inland Port Facilities: $13,176,000
Housing and Community Development: $12,372,000
Protective Inspection and Regulation, NEC: $6,007,000
Parking Facilities: $4,424,000
Parks and Recreation: $122,000
- DISCONTINUED for 2005 (Formerly: Long Term Debt Outstanding Nonguaranteed – Industrial Revenue): $1,005,648,000
- Employee Retirement – Total Other Securities: $1,638,303,000
Earnings on Investments (calculated): $867,882,000
Total Cash and Deposits: $814,295,000
Benefit Payments: $257,929,000
From Parent Local Government: $226,130,000
Other Investments – Other: $140,337,000
Local Employee Contribution: $107,544,000
Withdrawals: $6,999,000
- Employee Retirement – Corporate Bonds: $-1,953,994,296
- Employee Retirement – Corporate Stocks: $1,479,276,000
- Federal Intergovernmental – All Other: $41,146,000
Housing and Community Development: $7,997,000
Air Transportation: $1,061,000
Natural Resources: $549,000
Education: $296,000
General Local Government Support: $85,000
- General – Interest on Debt: $174,068,000
- Intergovernmental to Local NEC – Elementary and Secondary Education: $48,736,000
- Intergovernmental to State – General – Other: $5,383,000
- Local Intergovernmental – Education: $43,937,000
All Other: $17,798,000
Housing and Community Development: $10,118,000
Transit Utilities: $3,142,000
- Long Term Debt Beginning Outstanding – Public Debt for Private Purpose: $1,036,967,000
- Long Term Debt Retired Nonguaranteed – Public Debt for Private Purpose: $31,319,000
- Long Term Debt Retired Unspecified Public Purpose: $848,521,000
- Miscellaneous – Interest Earnings: $181,246,000
Fines and Forfeits: $40,554,000
Rents: $34,810,000
General Revenue, NEC: $31,818,000
Sale of Property: $749,000
Special Assessments: $142,000
Royalties: $48,000
- NEW for 2005 – Long Term Debt Beginning Outstanding – Unspecified Public Purpose: $2,136,086,000
Long Term Debt Outstanding Unspecified Public Purpose: $1,850,448,000
Long Term Debt Issue, Unspecified Public Purpose: $562,883,000
Assistance and Subsidies – Public Welfare, Federal Categorical Assistance Programs: $210,973,000
Assistance and Subsidies – Public Welfare, Cash Assistance Programs – Other: $6,483,000
- Other Capital Outlay – General – Other: $23,017,000
Solid Waste Management: $21,294,000
Regular Highways: $9,798,000
Police Protection: $5,204,000
Correctional Institutions: $4,800,000
Air Transportation: $4,220,000
Public Welfare – Other: $3,542,000
Health – Other: $3,232,000
General Public Building: $2,259,000
Judicial and Legal Services: $1,752,000
Parking Facilities: $1,613,000
Elementary and Secondary Education: $1,526,000
Sea and Inland Port Facilities: $940,000
Financial Administration: $733,000
Central Staff Services: $250,000
Parks and Recreation: $150,000
Corrections – Other: $106,000
Libraries: $36,000
Natural Resources – Other: $11,000
- Other Funds – Cash and Securities: $1,829,996,000
- Sinking Funds – Cash and Securities: $1,510,216,000
- State Intergovernmental – Public Welfare: $649,806,000
All Other: $431,249,000
General Local Government Support: $392,179,000
Health and Hospitals: $171,904,000
Education: $131,841,000
Highways: $23,277,000
- Tax – Property: $536,067,000
General Sales and Gross Receipts: $43,180,000
Documentary and Stock Transfer: $27,794,000
Occupation and Business License, NEC: $9,620,000
Other License: $4,964,000
Public Utilities Sales: $2,793,000
NEC: $1,447,000
Other Selective Sales: $157,000
- Total Salaries and Wages: $1,100,684,000
Supplemental Security Income (SSI) in 2006:
- Total number of recipients: 66,419
- Number of aged recipients: 27,280
- Number of blind and disabled recipients: 39,139
- Number of recipients under 18: 3,967
- Number of recipients between 18 and 64: 25,147
- Number of recipients older than 64: 37,305
- Number of recipients also receiving OASDI: 22,194
- Amount of payments (thousands of dollars): 40,071
| Home Mortgage Disclosure Act Aggregated Statistics For Year 2009 (Based on 577 full tracts) |
||||||||||||||
| A) FHA, FSA/RHS & VA Home Purchase Loans |
B) Conventional Home Purchase Loans |
C) Refinancings | D) Home Improvement Loans | E) Loans on Dwellings For 5+ Families | F) Non-occupant Loans on < 5 Family Dwellings (A B C & D) |
G) Loans On Manufactured Home Dwelling (A B C & D) |
||||||||
|---|---|---|---|---|---|---|---|---|---|---|---|---|---|---|
| Number | Average Value | Number | Average Value | Number | Average Value | Number | Average Value | Number | Average Value | Number | Average Value | Number | Average Value | |
| LOANS ORIGINATED | 6,605 | $361,798 | 16,016 | $392,753 | 62,612 | $355,838 | 2,631 | $266,416 | 150 | $7,286,647 | 5,462 | $352,838 | 217 | $98,438 |
| APPLICATIONS APPROVED, NOT ACCEPTED | 722 | $345,316 | 2,362 | $390,290 | 7,315 | $371,849 | 414 | $142,333 | 2 | $1,805,000 | 798 | $335,139 | 150 | $90,407 |
| APPLICATIONS DENIED | 1,557 | $349,981 | 3,924 | $390,824 | 18,779 | $410,539 | 991 | $177,906 | 41 | $1,406,098 | 2,361 | $329,130 | 314 | $83,551 |
| APPLICATIONS WITHDRAWN | 1,114 | $356,751 | 3,188 | $397,203 | 11,632 | $391,748 | 575 | $244,049 | 11 | $8,818,273 | 1,202 | $318,811 | 27 | $126,778 |
| FILES CLOSED FOR INCOMPLETENESS | 307 | $338,629 | 734 | $401,462 | 3,628 | $395,183 | 157 | $277,274 | 6 | $566,833 | 333 | $348,865 | 25 | $97,440 |
| Private Mortgage Insurance Companies Aggregated Statistics For Year 2009 (Based on 516 full tracts) |
||||||
| A) Conventional Home Purchase Loans |
B) Refinancings | C) Non-occupant Loans on < 5 Family Dwellings (A & B) |
||||
|---|---|---|---|---|---|---|
| Number | Average Value | Number | Average Value | Number | Average Value | |
| LOANS ORIGINATED | 1,125 | $342,044 | 266 | $389,229 | 5 | $277,600 |
| APPLICATIONS APPROVED, NOT ACCEPTED | 634 | $344,413 | 231 | $410,801 | 4 | $312,250 |
| APPLICATIONS DENIED | 330 | $361,909 | 199 | $413,809 | 5 | $259,400 |
| APPLICATIONS WITHDRAWN | 117 | $368,231 | 65 | $430,092 | 2 | $338,500 |
| FILES CLOSED FOR INCOMPLETENESS | 74 | $352,338 | 20 | $450,800 | 7 | $364,429 |
| Most common first names in Orange County, CA among deceased individuals | ||
| Name | Count | Lived (average) |
|---|---|---|
| John | 8,278 | 74.9 years |
| Mary | 7,614 | 80.2 years |
| William | 7,028 | 75.6 years |
| Robert | 6,931 | 72.5 years |
| James | 5,358 | 72.7 years |
| Helen | 4,381 | 81.9 years |
| Charles | 4,223 | 75.5 years |
| George | 4,064 | 76.7 years |
| Dorothy | 3,914 | 80.5 years |
| Margaret | 3,908 | 80.9 years |
| Most common last names in Orange County, CA among deceased individuals | ||
| Last name | Count | Lived (average) |
|---|---|---|
| Smith | 2,989 | 77.4 years |
| Johnson | 2,080 | 77.6 years |
| Miller | 1,701 | 77.3 years |
| Brown | 1,601 | 77.2 years |
| Nguyen | 1,592 | 75.5 years |
| Jones | 1,339 | 76.3 years |
| Anderson | 1,248 | 78.2 years |
| Williams | 1,214 | 77.0 years |
| Davis | 1,103 | 77.2 years |
| Wilson | 1,050 | 77.2 years |
| Businesses in Orange County, CA | ||||
| Name | Count | Name | Count | |
|---|---|---|---|---|
| 7-Eleven | 133 | Kroger | 60 | |
| AMF Bowling | 2 | LENSCRAFTERS | 12 | |
| AT&T | 28 | La Quinta | 5 | |
| Abercrombie & Fitch | 4 | La-Z-Boy | 5 | |
| Abercrombie Kids | 3 | Lane Furniture | 17 | |
| Aeropostale | 6 | Lowes | 8 | |
| Ann Taylor | 13 | Macy’s | 9 | |
| Apple Store | 5 | Marriott | 30 | |
| Arby’s | 13 | Marshalls | 10 | |
| Ashley Furniture | 2 | MasterBrand Cabinets | 147 | |
| AutoZone | 34 | McDonald’s | 95 | |
| BEBE | 5 | Motel 6 | 11 | |
| Bath & Body Works | 15 | Nordstrom | 9 | |
| Bed Bath & Beyond | 9 | Office Depot | 15 | |
| Bentleymotors.Com | 1 | OfficeMax | 5 | |
| Best Western | 22 | Outback Steakhouse | 8 | |
| Blockbuster | 28 | Panda Express | 35 | |
| Brookstone | 5 | Panera Bread | 16 | |
| Buffalo Wild Wings | 5 | Papa John’s Pizza | 14 | |
| Burger King | 41 | Payless | 41 | |
| CarMax | 3 | PetSmart | 14 | |
| Chick-Fil-A | 9 | Pizza Hut | 44 | |
| Chipotle | 19 | Popeyes | 5 | |
| Cinnabon | 5 | Quality | 2 | |
| Clarion | 1 | Quiznos | 48 | |
| Comfort Inn | 6 | RadioShack | 49 | |
| Comfort Suites | 2 | Ramada | 4 | |
| Costco | 12 | Red Robin | 9 | |
| DHL | 41 | Rite Aid | 41 | |
| Dairy Queen | 16 | Rodeway Inn | 1 | |
| Days Inn | 5 | SONIC Drive-In | 3 | |
| Decora Cabinetry | 33 | Safeway | 29 | |
| Dennys | 39 | Saks Fifth Avenue | 1 | |
| Domino’s Pizza | 28 | Sam’s Club | 4 | |
| Econo Lodge | 3 | Sears | 24 | |
| Eddie Bauer | 1 | Sephora | 5 | |
| FedEx | 354 | Spencer Gifts | 5 | |
| Foot Locker | 6 | Sprint Nextel | 27 | |
| GNC | 49 | Staples | 24 | |
| GameStop | 46 | Starbucks | 194 | |
| Gap | 7 | Subway | 86 | |
| Gymboree | 7 | Super 8 | 5 | |
| H&R Block | 71 | T-Mobile | 114 | |
| Haagen-Dazs | 5 | T.J.Maxx | 12 | |
| Haworth | 1 | Taco Bell | 72 | |
| Holiday Inn | 25 | Target | 28 | |
| Hollister Co. | 4 | The Limited | 5 | |
| Home Depot | 23 | Toys”R”Us | 14 | |
| Howard Johnson | 4 | Travelodge | 4 | |
| IHOP | 23 | UPS | 378 | |
| JCPenney | 7 | Verizon Wireless | 28 | |
| Jack In The Box | 32 | Victoria’s Secret | 10 | |
| KFC | 40 | Walgreens | 43 | |
| Kincaid | 6 | Walmart | 11 | |
| Kmart | 3 | Wendy’s | 22 | |
| Knights Inn | 1 | Whole Foods Market | 3 | |
| Kohl’s | 12 | YMCA | 12 | |
Orange County on our top lists:
- #12 on the list of “Top 101 counties with the highest Nitrogen Dioxide air pollution readings in 2005 (ppm)”
- #56 on the list of “Top 101 counties with the largest number of people moving out compared to moving in (pop. 50,000+)”
- #67 on the list of “Top 101 counties with the highest carbon monoxide air pollution readings in 2005 (ppm)”
- #79 on the list of “Top 101 counties with the highest Particulate Matter (PM2.5) 24-hour air pollution readings in 2005 (µg/m3)”
- #82 on the list of “Top 101 counties with the highest Particulate Matter (PM10) Annual air pollution readings in 2005 (µg/m3)”
Read more: http://www.city-data.com/county/Orange_County-CA.html#ixzz1PhyNhCrW
Irvine real estate, Laguna Niguel real estate, Foothill Ranch real estate, Huntington Beach real estate, Capistrano Beach real estate, Corona Del Mar real estate, Dana Point real estate, Lake Forest real estate, Laguna Woods real estate, Laguna Beach real estate, Laguna Hills real estate, Aliso Viejo real estate, Newport Coast real estate, , San Clemente real estate, Trabuco Canyon real estate, Rancho Santa Margarita real estate, Mission Viejo real estate, Ladera Ranch real estate, Tustin real estate, Villa Park real estate, Costa Mesa real estate, Orange real estate, Anaheim real estate, Garden Grove real estate, Yorba Linda real estate, Corona real estate, Fountain Valley real estate, Placentia real estate, Chino real estate, Portola Hills real estate, Chino Hills real estate, Norco real estate, Whittier real estate, Buena Park real estate, La Palma real estate, Cypress real estate, La Habra real estate, La Mirada real estate, Stanton real estate, Artesia real estate, Lakewood real estate, Los Alamitos real estate, Seal Beach real estate, Sunset Beach real estate, Surfside real estate, Mira Loma real estate, Ontario real estate, Diamond Bar real estate, Camp Pendleton real estate, Fallbrook real estate, Riverside real estate, Lake Elsinore real estate, Murrieta real estate, Perris real estate, Menifee real estate, Sun City real estate, Temecula real estate, Wildomar real estate, Irvine real estate, Huntington Beach real estate, Laguna Niguel real estate, El Toro real estate, Foothill Ranch real estate, Capistrano Beach real estate, East Irvine real estate, Midway City real estate, Newport Beach real estate, San Juan Capistrano real estate, Silverado real estate, Westminster real estate, Ladera Ranch real estate, Santa Ana real estate, Atwood real estate, Brea real estate, Fullerton real estate, Norco real estate, Coto De Caza real Estate, Dove Canyon Real estate, Robinson Ranch Real estate, Las Flores real estate,
_____________________________________________________________________
City of Temecula, CA At A Glance
Learn more about the wonderful city of Temecula, CA!
Schools
The Temecula Valley Unified School District (TVUSD) governs the public school system in Temecula, CA. To find out what school(s) your home is zoned for and/or learn more about TVUSD, visit the TVUSD website. Use the links below to find out more about each school in TVUSD.
Elementary Schools
Abby Reinke* – 43799 Sunny Meadows Drive – 951-302-6610
Barnett (Ysabel) – 39925 Harveston Drive – 951-296-5579
Crowne Hill – 33535 Old Kent Drive – 951-294-6370
Jackson (Helen Hunt) – 32400 Camino San Dimas – 951-302-5199
Nicolas Valley* – 39600 N General Kearney – 951-695-7180
Paloma* – 42940 Via Rami – 951-302-5165
Pauba Valley – 33125 Regina Drive – 951-302-5140
Rancho – 31530 La Serena Way – 951-695-7150
Red Hawk* – 32045 Camino San Jose – 951-302-5125
Sparkman (Joan F.) – 32225 Pio Pico Road – 951-302-5100
Temecula* – 41951 Moraga Road – 951-695-7130
Temecula Luiseno – 45754 Wolf Creek Dr N – 951-294-6340
Tony Tobin – 45200 Morgan Hill Drive – 951-294-6355
Vail* – 29915 Mira Loma Drive – 951-695-7140
Vintage Hills* – 42240 Camino Romo – 951-695-4260
Middle Schools
Bella Vista – 31650 Browning St – 951-294-6600
Day (James L.)* – 40775 Camino Campos Verdes – 951-699-8138
Gardner (Erle Stanley) – 45125 Via Del Coronado – 951-699-0080
Margarita – 30600 Margarita Rd – 951-695-7370
Temecula – 42075 Meadows Pkwy – 951-302-5151
Vail Ranch* – 33340 Camino Piedra Rojo – 951-302-5188
High Schools
Chaparral – 27215 Nicolas Rd – 951-695-4200
Great Oak – 32555 Deer Hollow Way – 951-294-6450
Temecula Valley* – 31555 Rancho Vista Rd – 951-695-7300
*These schools have earned the title of California Distinguished School, an award given by the California State Board of Education to public schools within the state that best represent exemplary and quality education programs.
Parks & Recreation
The Ronald Reagan Sports Park (formerly named the Rancho California Sports Park) is a 128 acre site located at 30875 Rancho Vista Road that provides the following amenities:
Five unlit ball fields
Five lit ball fields
Two lit football/soccer fields
Children’s play area
Picnic shelter
BBQs
Picnic tables
Restrooms
The Ronald Reagan Sports Park is also home to the Community Recreation Center (CRC) and the Temecula Skate Park. The CRC complex houses class and meeting rooms, lockers, a gymnasium, swimming pool, teen room with big screen tv and video games, ping-pong and pool tables, a multi-purpose room with stage and kitchen facilities, and an outdoor amphitheater. The CRC pool provides a 25-yard heated pool with a depth range of 3 1/2 feet to 12 feet. The pool area includes a diving board, water slide, indoor showers, dressing rooms, and lockers.
The Temecula Skate Park offers the ultimate skateboarding and in-line skating experience. The park consists of a competition 60-foot diameter bowl with ramp entry. A 10-foot wide apron connects the upper bowl with a street plaza skate area. The street plaza has a pyramid, fun box, curbs, ramps, stairs and a 20 foot hand rail. The park is staffed and open to the public for various sessions per day, 7 days a week. Special beginner sessions are also offered. The facility is lighted for night skating and can accommodate a maximum capacity of 35 skaters at one time. A resident information form and waiver must be completed and signed prior to entry into the facility.
Other facilities such as the Patricia H. Birdsall Sports Park, the Temecula Duck Pond & Veterans Memorial, and the Temecula Community Center are available for the enjoyment of Temecula’s residents.
Shopping, Dining, & Entertainment
Temecula is full of wonderful things to see and do all year round. One of the more popular destinations in Temecula is Old Town. Established in 1882 when the California Railroad came through the valley, Old Town is now home to a variety of specialty boutiques, art galleries and hundreds of antique stores as well as a vast selection of restaurants and the Old Town Community Theater. Visit OldTownTemecula.com for a complete listing of restaurants and planned events.
For those who enjoy the excitement of Vegas-style gambling, there is the Pechanga Resort and Casino. You can get in the action with slots, blackjack, poker, craps, or roulette-there is something for everyone! You can also see a show at the Comedy Club, get a relaxing message or facial at the spa, or take in 18-holes at the world-class Journey golf course. Visit Pechanga.com for more information.
If you want to get into the outdoors, Temecula is the place for you! Home to the world-famous thermal winds, aerial sports like hot air ballooning, skydiving, and hang gliding very popular and sure to get your adrenaline pumping. If you are into water sports, the lakeside venues in Temecula Valley offer boating, fishing, kayaking, canoeing, water skiing, jet skiing, sailing, wind surfing, swimming, and scuba diving. You can also explore Temecula’s backcountry trails via bike, hike, or horseback.
Wineries
Temecula Valley is Southern California’s Wine Country. With award winning wine and great restaurants and shops, Temecula Valley Wineries have something for everyone. Here is a list of some of the wineries Temecula Valley has to offer:
Baily Vineyard & Winery – 33440 La Serena Way – 951-676-9463
Bella Vista Vineyard & Winery – 41220 Calle Contento – 951-676-5250
Briar Rose Winery – 41720 Calle Cabrillo – 951-308-1098
Callaway Vineyard & Winery – 32720 Rancho California Road – 951-676-4001
Cougar Vineyard & Winery – 39870 De Portola Road – 951-491-0825
Doffo Vineyard & Winery – 36083 Summitville – 714-715-6610
Falkner Winery – 40620 Calle Contento – 951-676-8231
Filsinger Vineyards & Winery – 39050 De Portola Road – 951-302-6363
Hart Winery – 41300 Avenida Biona – 951-676-6300
Keyways Vineyards & Winery – 37338 De Portola Road – 951-302-7888
La Cereza Winery – 34567 Rancho California Road – 951-699-6961
Leonesse Cellars – 38311 De Portola Road – 951-302-7601
Maurice Car’rie Vineyard & Winery – 34225 Rancho California Road – 951-676-1711
Miramonte Winery – 33410 Rancho California Road – 951-506-5500
Oak Mountain Winery – 36522 Via Verde – 951-699-9102
Palumbo Family Vineyards & Winery – 40150 Barksdale Circle – 951-676-7900
Ponte Family Winery – 35053 Rancho California Road – 951-694-8855
South Coast Winery Resort & Spa – 34843 Rancho California Road – 951-587-9463
Stuart Cellars – 33515 Rancho California Road – 888-260-0870
Thornton Winery – 32575 Rancho California Road – 951-699-0099
Wiens Family Cellars – 951-694-9892
Wilson Creek Winery & Vineyard – 35960 Rancho California Road – 951-699-9463
Additional Resources:
Temecula Valley News
City of Temecula Website
Ready to buy a home in Temecula? Search for homes in Temecula here or contact me today!
[schema type=”review” url=”http://www.OrangeCountyShortSaleBroker.com” name=”Highly Recommend” description=”Jesse Madison Real Estate Agent” rev_name=”Homebuyer 2011″ rev_body=”Very reliable and dedicated, took his time to show me homes in foreclosure in my area plus a few investment properties, also gave us lots of helpful tips before buying I was not aware of. He speaks Spanish, that also helped me and my wife take a decision. Thanks Jesse!” author=”F. Solitro” pubdate=”2011-02-23″ user_review=”5″ min_review=”1″ max_review=”5″ ]